A 37 kW centrifugal pump running 7,000 hours a year in South Australia costs approximately AUD $109,200 per year in electricity alone — at the state’s 42c/kWh commercial rate. Over 15 years, that is AUD $1.638 million in energy for a single pump. The pump’s purchase price was AUD $8,500.
The purchase price is less than half of one year’s electricity bill. And yet it is the number that dominates most Australian industrial pump procurement decisions.
This is the pump total cost of ownership problem — and it costs Australian industry hundreds of millions of dollars every year in avoidable energy waste, premature pump failures, and maintenance labour on pumps that were selected for the wrong reason. If you are about to buy an industrial pump, or you have recently bought one and it is not performing as expected, this guide gives you the framework to make the correct decision — the one that costs the least over the pump’s actual service life, not just on day one.
If you are comparing two pump quotes and the cheaper one looks attractive — run the LCC calculation in Section 4 of this guide before signing a purchase order. A AUD $3,000 price difference between two pumps can produce a AUD $60,000+ difference in lifecycle cost. Pump Power Australia’s engineering team can run this calculation for your specific duty point, electricity tariff, and operating hours at no charge. Call +61 3 9933 7400 or enquire online.
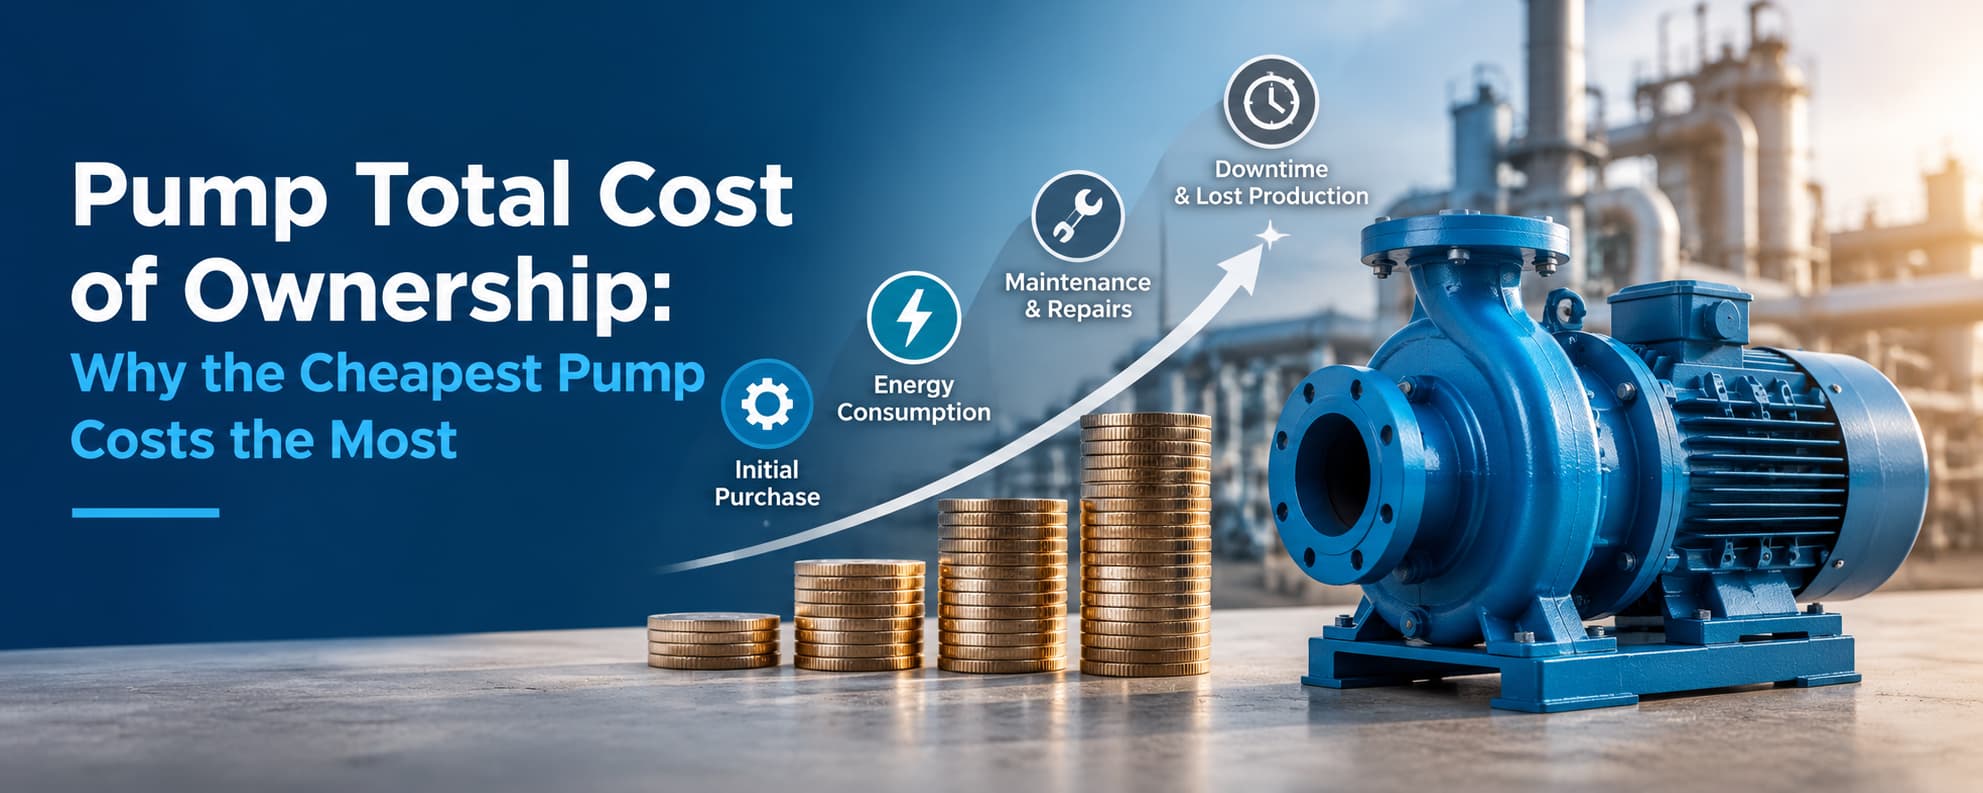
Pump total cost of ownership (TCO) — also called lifecycle cost (LCC) — is the sum of every cost incurred from purchasing an industrial pump through to decommissioning it: acquisition price, installation and commissioning, energy consumption, routine maintenance, spare parts, unplanned downtime, environmental compliance, and disposal. For a continuously-running industrial pump, the purchase price typically represents only 2–5% of total lifecycle cost. Energy consumption accounts for 60–85% and maintenance for 10–20%. Choosing a pump on purchase price alone — without calculating TCO — is one of the most common and costly procurement mistakes in Australian industry.
1. The 7 Cost Components of Industrial Pump Ownership
Before you can calculate pump TCO, you need to understand what goes into it. These are the seven cost categories recognised by the Hydraulic Institute (HI 40.6), ISO 15686, and the Grundfos lifecycle cost methodology — the global standards for industrial pump LCC analysis.
Pumping systems account for more than 20% of the world’s total electrical energy demand, and in certain industrial plants, they consume 25–50% of all site electricity (Grundfos, Hydraulic Institute). The cost distribution above explains why: a 1% improvement in pump efficiency saves 1% of 60–85% of LCC — a proportional saving that dwarfs any realistic reduction in purchase price. You can negotiate 10% off the pump price and save 0.2–0.5% of LCC. Or you can specify a 2% more efficient pump and save 1.2–1.7% of LCC — for free, just by asking the right questions at specification stage.
2. The Pump LCC Formula — Plain English Explanation
The standard pump lifecycle cost formula (per Hydraulic Institute HI 40.6 and ISO 15686) is:
Energy Cost Calculation — Step by Step
The energy cost component (Ce) requires the most careful calculation. The formula:
3. Why Energy Cost Dominates Pump LCC — The Numbers That Change Everything
The energy dominance of pump LCC is not obvious until you see the numbers side by side. The reason energy accounts for 60–85% of lifetime cost is simple arithmetic: a centrifugal pump running 7,000 hours per year for 15 years runs for 105,000 hours. Every hour it is consuming electricity. And every percentage point of efficiency improvement saves that electricity cost, every single hour, for 15 years.
Consider two centrifugal pumps of identical flow and head specification:
| Parameter | Budget Pump | Premium Pump |
|---|---|---|
| Purchase price | AUD $5,500 | AUD $8,200 |
| Flow / Head | 15 L/s at 40m | 15 L/s at 40m |
| Pump efficiency at operating point | 65% | 80% |
| Motor efficiency (IE2 vs IE4) | 91% | 94% |
| Motor input power | 9.9 kW | 7.8 kW |
| Annual energy cost (VIC 28c/kWh, 7,000 hrs) | AUD $19,404 | AUD $15,288 |
| Annual energy cost (SA 42c/kWh, 7,000 hrs) | AUD $29,106 | AUD $22,932 |
| 15-year energy difference (VIC) | AUD $61,740 MORE for the budget pump | |
| 15-year energy difference (SA) | AUD $92,610 MORE for the budget pump in SA | |
4. Australian Electricity Rates by State — How Location Multiplies the LCC Gap
Australian commercial electricity rates vary significantly by state — and every cent of difference multiplies directly through the energy cost calculation for every pump, every hour it runs. This is why a pump selection decision that seems marginal in Victoria becomes urgent in South Australia.
The electricity rate difference between SA (42c/kWh) and the ACT (24c/kWh) is 75%. That same pump, running the same hours, doing the same work, costs 75% more to run in SA than in the ACT. This means pump efficiency is approximately 75% more valuable to an SA operator than to an ACT operator — and the SA LCC case for upgrading to a higher-efficiency pump closes 75% faster. For SA industrial operators: efficiency specification deserves more attention than anywhere else in Australia. See our Adelaide location page for the specific SA electricity context.
5. Three-Pump 15-Year LCC Comparison — Budget vs Standard vs Premium (AUD)
This is the comparison every Australian pump procurement decision should start with. We compare three pumps of identical flow and head specification — a budget import, a standard mid-range, and a premium efficiency specification — across all seven LCC components over 15 years. Application: 37 kW centrifugal pump, 45 L/s at 55m head, running 7,000 hours per year, Queensland electricity rate 35c/kWh.
| Cost component | Budget pump Import, IE2 motor, 68% eff. |
Standard pump Name brand, IE3 motor, 76% eff. |
Premium pump High-efficiency, IE4 motor, 83% eff. |
|---|---|---|---|
| Purchase price (Cic) | $6,200 | $11,500 | $18,500 |
| Installation (Cin) | $3,500 | $3,500 | $3,500 |
| Motor input power | 55.3 kW | 47.8 kW | 42.9 kW |
| Annual energy cost (QLD 35c) | $135,235 | $116,830 | $104,895 |
| 15-year energy cost (Ce) | $2,028,525 | $1,752,450 | $1,573,425 |
| 15-year maintenance (Cm) Budget: 5%/yr; Std: 3%/yr; Prem: 2.5%/yr |
$46,500 | $51,750 | $69,375 |
| 15-year downtime (Cs) Estimated unplanned failures × 12 hrs × $15,000/hr |
$180,000 (10 failures) |
$72,000 (4 failures) |
$36,000 (2 failures) |
| Decommissioning (Cd) | $1,200 | $1,500 | $1,800 |
| TOTAL 15-YEAR LCC |
$2,265,925
Cheapest purchase, most expensive to own
|
$1,882,700
Middle ground — good balance
|
$1,702,600
Highest purchase price — lowest total cost
|
6. IE4 and IE5 Motor Efficiency — The Hidden LCC Multiplier
The motor attached to your pump contributes as much to total energy cost as the pump itself — yet motor efficiency class is frequently not specified in Australian pump procurement. The international motor efficiency classification system (IEC 60034-30-1) defines:
| Motor class | Classification | Typical efficiency (37 kW, 4-pole) | Annual saving vs IE2 (37 kW, QLD 35c, 7,000 hrs) |
|---|---|---|---|
| IE2 | High efficiency — AU minimum standard | ~92.6% | Baseline (0) |
| IE3 | Premium efficiency | ~93.6% | AUD $2,940/yr savings |
| IE4 | Super premium efficiency | ~94.5% | AUD $5,502/yr savings |
| IE5 | Ultra premium efficiency | ~95.5%+ | AUD $8,340/yr savings |
At Queensland’s 35c/kWh rate, upgrading from an IE2 to an IE4 motor on a 37 kW pump running 7,000 hours/year saves AUD $5,502 per year — or AUD $82,530 over 15 years. The IE4 motor costs approximately AUD $1,500–$3,000 more than an IE2 at this power rating. Payback: under 7 months. At SA’s 42c/kWh rate, the annual saving becomes AUD $6,602 — payback under 6 months.
The 2026 State of the Industry survey (Pump Industry Magazine) noted growing customer demand for IE4, IE5, and even IE6 motors in Australia — reflecting exactly this economics argument. The current Australian minimum standard (IE2) is widely regarded as inadequate for any continuously running pump application. Always specify IE4 minimum for any pump running more than 4,000 hours per year. For a full guide to VSD and motor efficiency savings, see our VSD energy savings guide.
7. Operating Point and BEP — The Efficiency Killer That Costs as Much as the Wrong Pump
A pump’s nameplate efficiency is not the efficiency at which it operates. Every centrifugal pump has a Best Efficiency Point (BEP) — a specific combination of flow and head at which it achieves its maximum hydraulic efficiency. Operate the pump away from BEP — whether to the left (low flow) or right (high flow) — and efficiency drops, energy consumption rises, and pump components experience accelerated wear.
A pump that operates at 65% of BEP flow instead of BEP consumes approximately 26% more electricity for the same hydraulic output — not because the pump is old or worn, but because it was selected for the wrong system or the system has changed. This is why system curve analysis is a prerequisite for pump LCC optimisation, not a nice-to-have. A pump operating at 65% efficiency on a permanently wrong system wastes AUD $60,000–$200,000 in electricity over its life — with no failure, no breakdown, nothing obviously wrong. Just a pump running slightly left of its curve, every hour, for 15 years.
For complete guidance on reading pump curves, finding the operating point, and using VFDs to maintain BEP operation under variable demand, see our pump performance curve guide and our VSD energy savings guide.
8. Five Scenarios Where a Cheap Pump Costs Significantly More — Australian Examples
Theory confirms that cheap pumps have higher LCC. But the magnitude of the difference varies enormously by application. These five scenarios show where the LCC gap is largest — and where the argument for LCC-based procurement is most compelling.
A slurry pump handling high-silica iron ore in pit dewatering service at a Pilbara mine. Budget pump with standard cast iron liners: liner life 6–8 weeks, requiring continuous replacement and pump rebuild. Annual maintenance cost: AUD $85,000. Premium high-chrome pump with 28% chrome white iron liners: liner life 18–24 weeks. Annual maintenance cost: AUD $34,000. Annual Cm difference: AUD $51,000. Over 10 years: AUD $510,000 — on a pump with a AUD $12,000 purchase price difference.
A centrifugal pump handling solvent at AUD $3/litre. Budget pump with standard gland packing: 3 L/hr leakage (acceptable for packing). Annual product loss: AUD $78,840. Premium pump with double mechanical seal (API Plan 53): 0.05 L/hr leakage. Annual product loss: AUD $1,314. Annual saving from sealing alone: AUD $77,526. The premium seal specification costs AUD $2,200 more. Payback: 10 days. See our mechanical seal vs gland packing guide for the complete TCO comparison.
A lobe pump transferring fresh salmon product. Budget pump with generic elastomers: FDA compliance uncertain, CIP cleaning requires additional chemical volume to compensate for surface roughness, 35% higher maintenance frequency. A single contamination incident in a food safety audit: product recall cost AUD $150,000–$500,000. Premium hygienic lobe pump with 316 SS and FDA-approved EPDM: full documentation, CIP-validated, smooth bore design. The “savings” on the budget lobe pump are AUD $3,400. A single food safety incident exceeds this by 40–150×.
A budget submersible dewatering pump fails during the Queensland wet season — March, during a cyclone event. Replacement parts not stocked in Australia, 4–6 week lead time from China. Mine pit floods. Cost of pit flooding and remediation: AUD $800,000–$2,400,000 (lost production + remediation). Alternative: premium Ritz pump with locally stocked genuine spare parts at Pump Power Australia, same-day dispatch from Brooklyn. Parts cost difference: AUD $1,800. See our mine dewatering guide for wet season design guidance.
A budget progressive cavity pump supplied without a dry-run protection device runs dry during a level sensor fault. Stator destroyed in 45 seconds. Replacement stator: AUD $1,800. But the pump also damaged the rotor chrome surface during the dry-run event — rotor replacement: AUD $2,400. Production downtime while parts arrive (2 days during peak processing): AUD $48,000. Total: AUD $52,200. The dry-run protection switch that was omitted to save AUD $280 at procurement produced a AUD $52,200 loss event.
9. LCC Procurement Checklist — What to Ask Before Buying Any Industrial Pump
This checklist applies to every Australian industrial pump purchase. For pumps running more than 4,000 hours/year, every item is mandatory. For intermittent or standby pumps, focus on items 1–5.
Ask the supplier to confirm pump efficiency at your actual flow and head — read from the pump curve. “80% efficiency” at BEP is irrelevant if your system will run the pump at 70% of BEP flow where efficiency is 68%.
If the quote does not specify motor class — assume IE2 (the cheapest). For any pump running more than 4,000 hours/year, specify IE4 minimum. Calculate the energy cost difference using your actual electricity tariff.
Use: Annual Ce = Pinput × hours × $/kWh. Multiply by 10 or 15 for the analysis period. For SA operations: use 42c/kWh. Compare energy cost difference between quoted pumps — it will usually exceed the purchase price difference many times over.
For any pump on a critical process, confirm that mechanical seals, bearings, impellers, and wear parts are stocked by an Australian supplier — not 4–8 weeks from China or Europe. Parts availability directly determines Cs (downtime cost). Pump Power Australia stocks genuine parts for all major brands.
Single, double, or cartridge? Elastomer material compatibility with your fluid? API flush plan? For hazardous, valuable, or food-grade fluids, seal specification is as important as pump selection. See our mechanical seal guide.
For any variable-flow application, a VFD typically returns its cost in energy savings within 12–18 months. For SA operations at 42c/kWh, payback is often under 8 months. A pump without VFD on a variable-flow system is running off-BEP for a proportion of every day.
Ask the supplier: expected mechanical seal life (years), bearing replacement interval (hours), impeller wear ring clearance check frequency, and estimated annual maintenance cost. Budget this into your LCC alongside purchase price.
Key Takeaways — Pump Total Cost of Ownership
- Purchase price represents only 2–5% of total pump LCC over 15 years — energy (60–85%) and maintenance (10–20%) are the dominant costs
- A pump with 15% lower purchase price but 10% lower efficiency will cost significantly more over its service life at any Australian electricity tariff above 20c/kWh
- South Australian operators at 42c/kWh benefit most from efficiency improvements — the LCC case for premium pumps closes approximately 50% faster than in Victoria
- Always calculate energy cost using the actual pump curve efficiency at your operating point — not the nameplate or peak efficiency
- Motor efficiency class (IE2 vs IE4) has a larger impact on LCC than most people realise — specify IE4 minimum for any pump running more than 4,000 hours/year
- Operating a pump off BEP is a continuous energy tax — a pump at 70% of BEP flow may consume 20% more electricity for the same output, every single hour
- Parts availability in Australia is an LCC factor — a cheap pump with no local spare parts support has an invisible Cs premium for every failure event
- For valuable, hazardous, or food-grade fluids, sealing quality is the dominant LCC factor — fluid loss cost can exceed all other LCC components combined
- Organisations that use LCC-based procurement consistently achieve 20–40% lower total pump ownership costs than those focused on purchase price alone
- Pump Power Australia provides free LCC analysis for any pump selection — call +61 3 9933 7400 or enquire online to compare the total cost of your pump options
10. Reddit, Quora and Forum Questions — Answered
These are the most commonly asked pump procurement and LCC questions from Reddit r/ChemicalEngineering, r/mechanical_engineering, r/AusFinance, and Australian industrial engineering forums — with direct, practical answers.
Numbers beat opinions. Run the energy cost calculation for both options using your actual electricity tariff and actual operating hours. Put the 15-year energy cost difference next to the purchase price difference. For a pump running 6,000+ hours/year, the energy cost difference will almost always exceed the purchase price difference by a factor of 5–20×. Present this as an NPV calculation — AUD $X saved today costs AUD $Y more over 15 years at 5% discount rate. Finance departments respond to NPV. Also: ask the pump supplier for a written 15-year LCC comparison — a supplier confident in their product will provide this; one that isn’t will hedge. We provide this calculation for any Australian customer at no charge.
Depends almost entirely on pump size, operating hours, and your electricity tariff. A quick calculation: Annual energy cost = Motor kW × Hours/year × $/kWh. For a 22 kW pump running 6,000 hrs/year in Victoria (28c/kWh): $22 × 6,000 × $0.28 = AUD $36,960 per year. Over 15 years: AUD $554,400. Purchase price for a 22 kW centrifugal pump: approximately AUD $4,000–$9,000. The pump pays for itself in electricity in 3 months. After that, 15 years of electricity costs that were determined on day one by your pump and motor selection. A 5% efficiency improvement saves AUD $1,848/year — or AUD $27,720 over 15 years. Worth specifying carefully.
For any pump running more than 4,000 hours/year: almost always yes. The cost premium for IE4 over IE2 at 15–37 kW is typically AUD $500–$3,000. The annual energy saving is typically AUD $2,000–$8,000 depending on the power rating and your electricity tariff. Payback is typically 3–12 months. After payback, the IE4 motor generates pure annual saving for the remaining 14–15 years of the pump’s service life. At SA’s 42c/kWh, the saving is approximately 50% larger — shorter payback, more total saving. The maths strongly favours IE4 in all Australian states except for intermittent pumps running fewer than 1,000 hours/year.
Calculate your actual annual maintenance cost for the cheap pump: seal replacements + bearing replacements + labour + downtime cost during each failure. Then get a quote for a quality replacement pump. If the annual maintenance cost of the cheap pump exceeds 15–25% of the quality pump’s purchase price — replace it now, don’t wait for the next failure. The calculation almost always shows that one more cheap pump is more expensive than switching to a reliable one — the money is already spent in maintenance, not recovered by the lower purchase price. Contact our Spares & Services team for a replacement pump assessment.
Yes — significantly, but not in the way most people think. On-paper specifications (flow, head, motor power) are relatively easy to match between manufacturers. What varies between pump brands is: (1) actual achieved efficiency at your operating point vs the curve published (how honest is the curve?); (2) seal quality and expected service life; (3) casting quality and dimensional accuracy (affects wear ring clearance, which determines long-term volumetric efficiency); (4) spare parts availability in Australia — critical for LCC. A cheap pump with no Australian spare parts support has an invisible Cs premium. Ask any supplier: where are the mechanical seals and bearings for this pump stocked in Australia? A confident answer vs a vague answer tells you everything about the LCC commitment behind the purchase price.
Frequently Asked Questions
Structured for Google People Also Ask, ChatGPT, Gemini, Claude, and Perplexity direct answer extraction.
Pump total cost of ownership (TCO) — also called lifecycle cost (LCC) — is the sum of every cost incurred from purchasing a pump through to decommissioning it: acquisition price, installation and commissioning, energy consumption, routine maintenance, spare parts, unplanned downtime, environmental compliance, and disposal. For a continuously running industrial pump, the purchase price typically represents only 2–5% of total lifecycle cost. Energy consumption accounts for 60–85% and maintenance for 10–20%. Choosing a pump on purchase price alone — without calculating LCC — consistently produces the highest total expenditure. Pump Power Australia provides free LCC analysis: call +61 3 9933 7400 or see our enquiry form.
Pump lifecycle cost (LCC) = Cic + Cin + Ce + Co + Cm + Cs + Cenv + Cd. The energy cost Ce is calculated as: Pinput (kW) × operating hours/year × electricity rate ($/kWh) × number of years. Pinput = [Q(m³/s) × H(m) × ρ(kg/m³) × 9.81] ÷ (pump efficiency × motor efficiency). Always use the pump’s actual efficiency at the operating point from the pump curve — not the nameplate or peak efficiency. Multiply Ce by the analysis period (10 or 15 years). Add Cic and Cm (estimated at 2–5% of purchase price per year for standard service). Sum all components to get LCC. For a step-by-step guide, see Section 2 of this article and our pump performance curve guide.
A cheaper pump typically achieves lower hydraulic efficiency, requiring more electricity to produce the same flow and head. The energy cost difference between a 65% efficient pump and an 80% efficient pump accumulates every hour the pump runs — for 15 years. On a 37 kW pump running 7,000 hours/year in Queensland at 35c/kWh, the 15% efficiency difference produces a 15-year energy cost difference of over AUD $250,000 — for a pump whose purchase price difference was AUD $5,000. Cheaper pumps also typically have lower quality seals and bearings, shorter service life, higher maintenance frequency, and no local Australian spare parts support — all of which add further to the total cost advantage of the premium specification.
For a continuously running industrial centrifugal pump operating 6,000–8,000 hours per year, energy consumption accounts for 60–85% of total lifecycle cost over a 15–20 year service life (Hydraulic Institute HI 40.6, Grundfos LCC methodology). Purchase price accounts for only 2–5%. Maintenance and spare parts account for 10–20%. This distribution means a 5–10% improvement in pump efficiency produces far greater savings than a 10–20% reduction in purchase price. Pumping systems globally account for more than 20% of total electrical energy demand — in some industrial plants, pumps consume 25–50% of all site electricity.
Australian commercial electricity rates vary by state: SA approximately 42c/kWh (highest mainland), QLD 35c/kWh, NSW/WA approximately 30c/kWh, VIC approximately 28c/kWh, ACT approximately 24c/kWh. Every 1c/kWh difference multiplies through every hour of pump operation for the full service life. SA operators accumulate energy costs approximately 75% faster than ACT operators for the same pump doing the same work. This makes the LCC advantage of premium efficiency pumps most compelling in SA, and means SA industrial operators should weight pump efficiency higher in their specification criteria than operators in lower-electricity-cost states. See our Adelaide location page for the full SA electricity context.
The standard pump LCC formula (HI 40.6 / ISO 15686): LCC = Cic + Cin + Ce + Co + Cm + Cs + Cenv + Cd. To calculate energy cost Ce: Annual energy cost = Pinput(kW) × hours/year × electricity rate ($/kWh). Pinput = [Q(m³/s) × H(m) × ρ × 9.81] ÷ (ηpump × ηmotor). For a worked example at Queensland rates and three pump specifications, see Section 5 of this article. For a formal NPV comparison, discount each year’s Ce, Cm, and Cs to present value at your organisation’s discount rate (typically 5–8% for Australian industrial assets).
LCC analysis is most valuable when: (1) the pump will run more than 4,000 hours per year; (2) you are comparing two or more pumps at different price points for the same duty; (3) the pump is critical to production and downtime has high cost; (4) the fluid is valuable, hazardous, or regulated; (5) the site electricity tariff is above 25c/kWh. For intermittent pumps running fewer than 1,000 hours/year, purchase price plays a proportionally larger role. For all other applications, failing to run an LCC analysis before pump purchase is a common and expensive procurement error. Pump Power Australia provides LCC analysis at no charge — contact our team.
CAPEX (capital expenditure) for a pump is the one-time purchase, delivery, and installation cost — what appears on the purchase order. OPEX (operating expenditure) is the ongoing running cost: energy, maintenance, spare parts, and labour. For most continuously running industrial pumps in Australia, OPEX over 10–15 years exceeds CAPEX by a factor of 5–20×. A pump selected purely to minimise CAPEX will typically maximise OPEX. LCC analysis combines CAPEX and OPEX into a single comparable figure. The goal is not to minimise CAPEX — it is to minimise LCC. Sometimes that means spending more on CAPEX to achieve significantly lower OPEX, delivering lower LCC overall.
Pump downtime cost (Cs) varies by application. General industrial process: AUD $10,000–$100,000 per unplanned shutdown (12 hours average). WA/QLD mining operations: AUD $50,000–$500,000 per day depending on commodity and throughput. Food processing during peak season: AUD $20,000–$200,000 per shift. Water utility: regulatory penalties plus bypass pumping. A single unplanned pump failure in a high-criticality application can exceed the pump’s entire purchase price many times over. This is why reliability (Cs reduction) is at least as important as efficiency (Ce reduction) in any honest LCC analysis — and why cheap pumps that fail more frequently can produce catastrophic total cost outcomes in critical applications.
Yes. Pump Power Australia’s engineering team provides LCC analysis for all Australian customers — comparing purchase price, energy cost, maintenance cost, and reliability across pump options for your specific duty point, electricity tariff, and operating hours. With over 35 years of experience supplying industrial pumps to Australian mining, water treatment, food processing, and chemical operations, our team has extensive real-world data on maintenance intervals and reliability by pump type and application. For a free LCC comparison across any pump options you are considering, contact our team on +61 3 9933 7400 or visit our enquiry page. We supply centrifugal pumps, progressive cavity pumps, gear pumps, slurry pumps, and the complete range of industrial pump types from our Brooklyn, VIC warehouse with fast freight to all Australian states.
Conclusion — The Procurement Decision That Saves (or Costs) the Most
The cheapest pump on the quote sheet is almost never the cheapest pump to own. The gap between purchase price and lifecycle cost is not a minor inconvenience — it is a factor of 5–20× in favour of energy, maintenance, and reliability over the 15-year service life that most Australian industrial pumps achieve.
The good news is that this calculation is not complicated. The LCC formula is straightforward. Your electricity tariff is on your invoice. Your pump’s operating hours are known. The efficiency at your operating point is on the pump curve. Within 30 minutes, you can produce an LCC comparison that will either validate the cheaper option or show clearly why it costs more over the long term.
If you would like Pump Power Australia’s engineering team to run this calculation for your specific pump application — comparing options from our range with a full 15-year LCC breakdown in Australian dollars — contact us. We have been supplying industrial pumps in Australia for over 35 years and we would rather spend 30 minutes helping you make the right decision than sell you the cheapest pump today and see it return as a warranty problem tomorrow.
References
- Hydraulic Institute — HI 40.6: Methods for Rotodynamic Pump Efficiency Testing and LCC Calculation: pumps.org
- Grundfos — “Lifecycle cost equation for pump systems”: grundfos.com
- Global Pumps Australia — “How much does a pump really cost?” (lifecycle cost breakdown): globalpumps.com.au
- CNTECHO — “Pump Lifecycle Costing: Comparing Price, Energy and Maintenance” (2026): cntecho.com
- Tractian — “Total Cost of Ownership” (industrial equipment LCC): tractian.com
- Dehuike Pump — “The Professional’s 2026 Guide: Complete Industrial Pump Lifecycle Cost Analysis” (Jun 2026): dhkpump.com
- Pump Industry Magazine — “What really drives pumping lifecycle costs” (October 8, 2026): pumpindustry.com.au
- Pump Industry Magazine — “State of the Industry: What’s in store for the pump industry in 2026?”: pumpindustry.com.au
- IEC 60034-30-1 — Rotating electrical machines: Efficiency classes of line operated AC motors (IE code)
- ISO 15686 — Buildings and constructed assets: Service life planning
- SolarScorecard — “Commercial Solar ACT 2026: Australian state electricity rates”: solarscorecard.com.au
- US Department of Energy — “Pump Life Cycle Costs: A Guide to LCC Analysis for Pumping Systems”: energy.gov
Get a Free Pump LCC Comparison in Australian Dollars
Tell us your pump duty point (flow, head, fluid), operating hours per year, state electricity tariff, and any quotes you are comparing — and our engineering team will produce a 15-year lifecycle cost comparison in Australian dollars, at no charge.
The analysis typically takes 24 hours. It will tell you, in dollars, whether the cheaper or more expensive pump costs less to own. That clarity is worth more than any negotiated discount.
📞 +61 3 9933 7400
✉ info@pumppower.com.au
9 Export Drive, Brooklyn VIC 3012 | Mon–Fri 8:00am–5:00pm AEST
This guide was prepared by the engineering team at Pump Power Australia, a specialist industrial pump supplier based in Brooklyn, Victoria, with over 35 years of experience specifying, supplying, and supporting pumps across Australian mining, water treatment, food processing, chemical, and marine industries. Pump Power Australia supplies BHP, Rio Tinto, Shell, Woodside, and hundreds of Australian industrial operations.
Related guides: VSD Energy Savings | Pump Performance Curve | Pump Maintenance Checklist | Mechanical Seal vs Gland Packing | Pump Cavitation Guide